send link to app
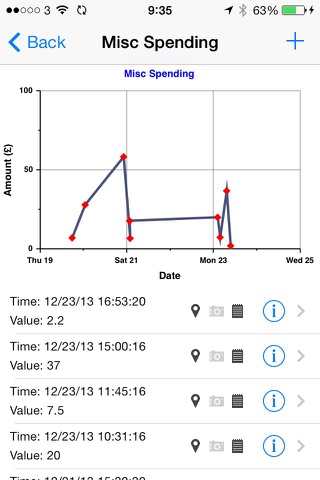
Easily capture & plot numerical/visual information. Charts allows you to record data points organized by category. Additionally add images to your data points to track and measure progress against personal or professional metrics.


